How to display Power BI data in the Origami KPI web part
To show data from Power BI in the Origami KPI web part, you’ll need to create a Power BI report in a specific format using the steps below.
We’ll use Microsoft Power BI Desktop, which you can download and install here: Power BI Desktop download.
1️⃣ Create the Power BI Report
-
Open Power BI Desktop.
-
Choose your data source.
For this example, select Learn with sample data.
-
On the next screen, click Load sample data.
-
Select a table to use (we’ll select financials for this example) and click Load.
-
In the Visualizations pane in the right-hand side of the screen , select the Card visualization:
-
A blank card will appear on your report:
-
In the Data pane, click the checkbox next to a measure (for example, Gross Sales) you want to display in the card:
-
The card will display the selected value:


![]() Tip: You can add multiple cards (steps 5–8) to show different KPIs: Here is how this will look like with 3 cards:
Tip: You can add multiple cards (steps 5–8) to show different KPIs: Here is how this will look like with 3 cards:

-
Click Publish in the ribbon to publish your report:
-
Save the report file locally and complete the publishing steps (choose your workspace, click Select).
5. 6. 7. 8. 9. 6.


2️⃣ Get Report and Card URLs
Now you’ll grab the URLs needed for the Origami KPI web part:
-
Go to Power BI online.
-
Select the workspace where you published the report:
-
Open your report:

-
In the report, click File → Embed report → SharePoint Online:
-
Copy the Embed URL provided.
-
Go to the SharePoint page with your Origami KPI web part.
Paste the Embed URL into the Power BI Report Embed URL field:
-
Back in Power BI, ensure you’re viewing the report in Reading view by clicking the reading view as shown below. If you don’t see the button, it means you’re already in reading view.
-
Click on the Card you want to show → click Share visual:
-
Paste the Card URL into the Value field of the Origami KPI web part:
-
Save the web part settings and publish the page.


3️⃣ Give all users Microsoft Fabric license
Microsoft Fabric is Microsoft’s all-in-one data analytics platform that combines tools like Power BI, Data Factory etc.
In order for other users to be able to see data coming from your PowerBI report, you will need to assign those users Microsoft Fabric license.
Here is what to do:
- Go to https://admin.microsoft.com/ and log in with administrative rights
- Click on the Users → Active users
- Select the user and wait for the properties flyout to open
- Under Licenses and apps category, find the Microsoft Fabric as shown below.

- Check the box next to it and click Save changes
![]() Your KPI web part will now display live data from your Power BI cards for applicable users!
Your KPI web part will now display live data from your Power BI cards for applicable users!
Error codes:
Contact your admin to enable embed code creation
Did you get this error while trying to get the embed code for the report:
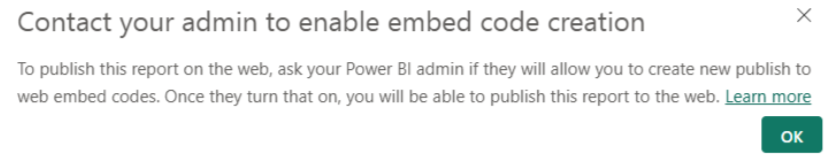
Steps for the Admin:
- Go to Power BI Admin Portal.
- Under Tenant settings, find Publish to web.
- Set it to “Enabled” for the appropriate users or security groups.
- Click Apply.